
My server Monitor
This never moved beyond a working prototype as it didn't meet my needs. I wasn't interested in a global overview that said all my servers were fine most of the time.
It is the basic global overview screen of all servers, with drill down into each server and its monitored components. Monitored components can have commands issued to them from the web interface. It is written as a PERL application, with a PERL/cgi front end for the web pages. All the background work is done with shell scripts so is easy to customise and maintain.
I strongly disagree with those monitoring tools that poll remote services, a waste of CPU and Network cycles,
so this has been designed as
(a) scripts run on the 'local' servers to build a status of the local server,
(b) periodically the main server requests a status refresh from the data collected by each 'local' server
(instead of polling all monitored components itself)
and uses that to populate its network/server/pheripheral|process-list displays.
That gives you your overview screen and drill down functions.
Commands can be issued from the web interface to monitored objects on the remote servers. The commands are restricted in two ways, first the web pages have start/stop links to issue the command to the object so users can't play, and second should someone manually type in a url/command the remote server has a ruleset of what commands are permitted to be issued against each object so unexpected commands are discarded.
As it was just a prototype the documentation is sparse, but apart from a PERL server and client to do the socket/tcpip stuff between servers it's all in shell script so you should have no trouble installing this to play with. Feel free to download and customise the sample BETA application if you want to play with it.
Examples
First off, yes all my examples are in error state. I unpacked the source from my archives and set it up to run on my test server, but the environment now is very different from when I first tested this; and no I'm not going to fix things up, after the screen shots are taken I'm deleting the app again. As noted above I don't use it.
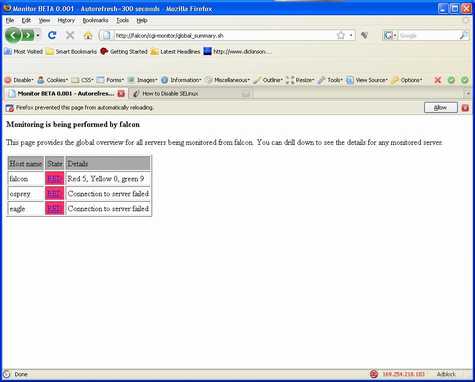 A global overview of three of my servers, the first
has outstanding errors, the other two are powered down so uncontactable. Where a server is contactable, you can see the
number of monitored items in error, warning and ok state.
A global overview of three of my servers, the first
has outstanding errors, the other two are powered down so uncontactable. Where a server is contactable, you can see the
number of monitored items in error, warning and ok state.
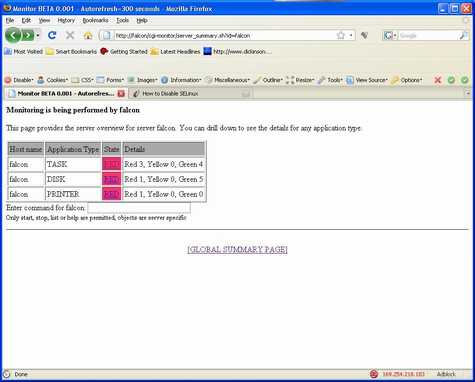 This is the drill down to the first server
(falcon). It shows what groups of components on this server are in warning or error state. Each group
entry has it's own totals of items in error, warning and ok state.
This is the drill down to the first server
(falcon). It shows what groups of components on this server are in warning or error state. Each group
entry has it's own totals of items in error, warning and ok state.
Note that you can enter commands to the remotely monitored entries from here.
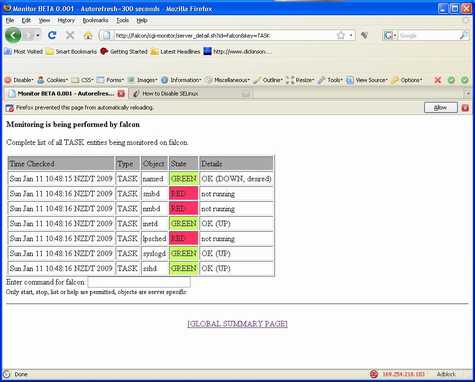 This is the display shown
when drilling down to the task group to see what state the tasks being monitored are in.
This is the display shown
when drilling down to the task group to see what state the tasks being monitored are in.
Note that you can enter commands to the remotely monitored entries from here.
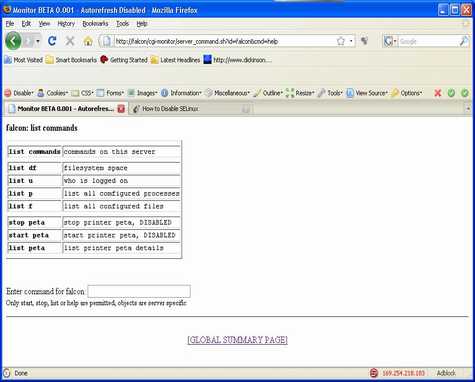 This is what is shown
if you type help into the command entry box. As you can see allowed commands go down to the
specific device level. This is required, you can see a start peta can be issued to printer
peta which is a monitored device, but even if petb was a monitored device no command
could be issued against petb unless it was also added to the command table, and more
importantly having allowed commands at the device level stops users being able to issue
any random commands.
This is what is shown
if you type help into the command entry box. As you can see allowed commands go down to the
specific device level. This is required, you can see a start peta can be issued to printer
peta which is a monitored device, but even if petb was a monitored device no command
could be issued against petb unless it was also added to the command table, and more
importantly having allowed commands at the device level stops users being able to issue
any random commands.
The allowed commands, start, stop and list, are passed to scripts to handle the
command intent. While this is intended for dummies who don't know the real unix commands to stop/start things
it also means that no native unix commands can ever be issued through the browser interface.
And the scripts on the web server can check the command is legal and valid before passing it to the remote server
which also checks the commands are allowed (the remote server may even have different rules if you either
have not been keeping things in sync or wanted to more tightly restrict the remote server)
before the script invokes the natcive unix command... with the
hard coded object name as defined in the command control file, users cannot just start/stop any object
they want.
One note on the 'list commands' option. I think I intended this to return a list of
commands accpted by the remote server as opposed to the help which lists commands accepted
by the host/web server; I can't remember if I ever implemented that (although it would
be really simple for you to do if I haven't).
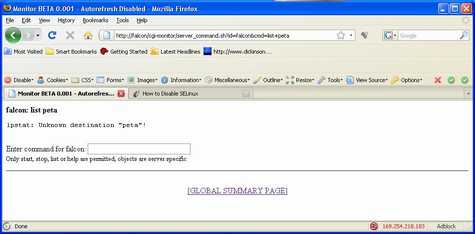 This just shows the
result of issuing the permitted list command against the printer. The result is the native
unix command response. In this case it shows printer peta is not defined, which is true, I
did say this ws an old ruleset, that printer doesn't exist.
This just shows the
result of issuing the permitted list command against the printer. The result is the native
unix command response. In this case it shows printer peta is not defined, which is true, I
did say this ws an old ruleset, that printer doesn't exist.
Feel free to download and customise the sample BETA application if you want to play with it.