
Linux Alert Toolkit
History
This tookit was written when I got my third home/personal linux server online. Linux as we all know chugs away quite happily in the background without intervention, so nobody checks the error logs every day do they. So it came as a bit of supprise when I found (when things started crashing) that one of the servers had been reporting disk problems for some time.
The solution, just trap and forward any errors I am interested in to a single server so
all alerts can be checked in one place that can be monitored from anywhere,
and throw in a bit of simple automation for luck, for free of course.
This toolkit is a collection of simple programs and scripts to do just that.
While I am aware syslog/rsyslog can be configured to send all messages to a single server to be monitored that does not meet my needs, the network overhead in a home lab would excessive, plus my monitoring scripts watch for things that are not in log files (such as processes using more cpu time than normal or not running at all) and while my scripts could be modified to write to syslog (although in fedora only the root user can use logger unless you setuid it to root), why do it that way ?; that would just result in the message target server having to filter out the message from the junk in syslog, much more sensible just to post the one message directly to my alert collector.
Install Requirements
You do require the GNU C (GCC) compiler installed. The install script will attempt to recompile the source code; and it needs to be able to !. Binary files are no longer shipped.
You should also have both java and java-devel (the openjdk option) installed if you wish to use the java interface. I find that I need to recompile all the class files and recreate the jar file after every OS upgrade, sometimes even between simple "dnf update" runs. Important: if you wish to use the java client interface ensure your runtime and development java versions match. Fedora 29 and Fedora 30 by default install java-1.8.0-openjdk-headless, if you then "dnf install java-devel" it will install java-11 for Fedora 29 or java-12 for Fedora 30, but classes compiled by those later versions javac cannot be run by the default installed java, so ensure you 'dnf -y install java-1.8.0-openjdk-devel' and not java-openjdk-devel to enable everything to work. (note: Fedora does this as LibreOffice on Fedora is dependant upon java-1.8.0-openjdk-headless, so you cannot use the latest java versions if you want to use LibreOffice, which is most desktops).
Known issues, well not issues, choices
The java applet functionality while available is no longer really an option as 90% of browsers no longer support java applets; that is a choice by the browser makers (the icedtea-web plugin no longer helps as firefox has disabled NPAPI features). If you can find an old browser the applet will work just fine.
The server component also gets confused under stress testing (100+ messages per second) but as it works OK under normal use I haven't spent any time resolving that.
Download and Documentation
- My alert forwarding toolkit (GCC, no database dependencies) (what I still use)
- Copies of the alert toolkit manuals are onlineonline manuals
- Download the install file for Linux Alert Toolkit (270K .tar.gz)An alert forwarding and monitoring toolkit
Functional Overview
The toolkit is comprised of- a daemon process that runs on one server of your choice to accept/collect alerts from the others
- some command line tools to raise and cancel alerts that you can use in your scripts, and supplied sample scripts
- some custom utilies I have written to search for problems, such as the log tailing/parsing task that can scan for log message text
- multiple alert monitoring interfaces into the alert collector daemon (vt100 based program, a web applet and a java application for windows/x-windows)
- and a automation rules table for each server so it can try to do script based automatic recovery of problems first and needs to only throw an alert if automations fails (which was an afterthought so possibly a bit complicated)
For the daemon process just pick a server to be the alert collector server, and create a rc script to start the daemon on that server at boot time. Then you can forget about it apart from adding its datestamped log files to any cleanup scripts you run daily.
The command line/script tools provide a way to raise and cancel alerts. Alerts may be raised as critical, warning, informational or log-only events. The supplied sample scripts have samples for process busy alerts, load average high alerts, file size monitoring alerts etc that you can customise for your own use. Review them as they demonstrate that every script that raises an alert is also responsible for cancelling it when the error condition no longer exists. The sample scripts also provide samples of the basic automation I have implemented, although you should definately refer to the manuals for that.
For the custom written utilites, which at the moment is only really the utility to load a message rule table and parse messages for log file tailing, sample scripts have been provided for this also, and it is fully covered in the manuals.
User Interfaces
For the alert monitoring interfaces the toolkit provides a vt100 interface for command line
use and also a
java GUI interface that may run as a standalone application (x-windows/windows/mac) on any machine
with Java 1.4 or above and if browser makers had not dropped applet support also as an applet
in a web page if you have a web server on the server you selected for the alert collector.
You now have no excuse for not watching alerts as you can view them from any networked machine.
The alerts can be viewed, acknowledged and deleted through the interfaces.
The VT100 interface looks like the below, it has online help for the commands. On the real display that last line (a critical) was in reverse text but that doesn't cut/paste well :-). By default blinking text is used for some messages, I found that annoying so there is a flag to turn it off.
 20110709 11:02 falcon          HEATBOARD      IO Motherboard temp          31
 20110709 11:02 falcon          HEATCPU        IO CPU temp          28
 20110709 11:05 eagle           HEATBOARD      IO Motherboard temp          32
 20110709 11:05 eagle           HEATCPU        IO CPU temp          22
 20110709 11:05 eagle           HEATSBUS       IO SBUS temp          44 (video card)
 20110709 11:00 falcon          CHKDSK_BSY_2   AC Disk IO block write threshold exceeded, investigate
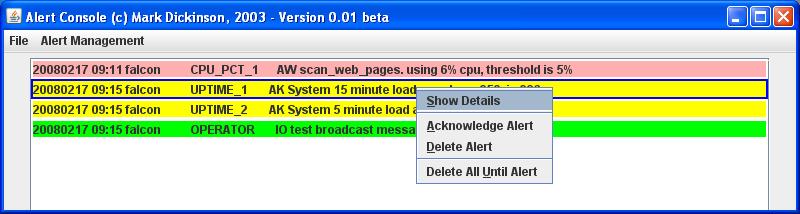
And this is a screenshot of the java interface. This looks the same run as a standalone java application
or run as a java applet from a web page, although as noted in the known issues section
browsers no longer support applets.
Design note
In the real world I have worked in IT with commercial alerting products, many of which
store alerts in databases, if they can't forward an alert queue it and wait until they can etc.;
I don't do/want that, nothing worse than being woken up at 3am for an alert that was finally
managed to be forwarded for an event that happened days ago.
My design is if an alert cannot
be forwarded just write the event to the local log and discard the event, it will always be in the
local log if you want to look back. Also I have implemented a 'clear all' event that can be raised,
this should be in your servers startup scripts (at the end of the rc2.d list I guess) so when a server
is rebooted after an unclean shutdown it forwards that event to your central server to clear any stale alerts
for the server being rebooted that are obviously
no longer relevant; and of course in your system shutdown scripts as there is no point
in having outstanding alerts for a server that is shutdown/rebooted cleanly.
In the same philosophy if for any reason the alert collector daemon is stopped/started all
alerts it knows about are lost, it could have been down long enough to make
the alerts useless, so lose them.
In short, my solution displays only current alerts, which is good.
If this design choice does not meet your needs it will be simple for you to edit the raise_alert.sh script to store alerts that cannot be forwarded, but I will not do it for you as I think forwarding stale alerts is a bad way of doing things.
Moving Forward
This should be considered truely unsupported.
I have taken this as far as it will ever go, it works perfectly for me and I need no further enhancements.
I do still use it myself, as while I looked at nagios passive monitoring events (found that easy to implement,
although I had to write my own send/recievce scripts)
I simply monitor too many events with my alert server scripts to want to define lots of passive nagios
services for each of my servers; sensible solution it to continue to let all servers forward events to
my alert server and have a single nagios service for that server using a nrpe script on that server
that simply highlights a service issue if critical alerts are greater than zero.
Other automation and monitoring tools
Yes I know about the pretty drill down to find a problem applications, I even played with that briefly, but it doesn't suit my needs. I want a simple screen with an error message that has the host name and what the problem is; not something that has to be drilled down through, I just want it in front of me. And I want to see problems only, not that everything is ok 99% of the time.
However some people do prefer that type of monitoring interface, so my prototype PERL implementation of that may be of interest. It was just a how do I do this type exercise, that works perfectly but I decided not to persue it, it wasn't what I wanted. If you want it there is more information on this.